Economy Data Observatory
Automated Data Observatory
Reprex
rOpenGov
Yes!Delft AI+Blockchain Validation Lab
Big data and automation create new inequalities and injustices and has a potential to create a jobless growth. Our Economy Observatory is a fully automated, open source, open data observatory that produces new indicators from open data sources and experimental big data sources, with authoritative copies and a modern API.
Our observatory is monitoring the European economy to protect the consumers and the small companies from unfair competition both from data and knowledge monopolization and robotization. We take a critical SME-, intellectual property policy and competition policy point of view automation, robotization, and the AI revolution on the service-oriented European social market economy.
We would like to create early-warning, risk, economic effect, and impact indicators that can be used in scientific, business and policy contexts for professionals who are working on re-setting the European economy after a devastating pandemic and in the age of AI. We would like to map data between economic activities (NACE), antitrust markets, and sub-national, regional, metropolitian area data.
Get involved in services: our ongoing projects, team of contributors, open-source libraries and use our data for publications. See some use cases.
Follow news about us or the more comprehensive Data & Lyrics blog.
Contact us .
Our automated observatory participates in the EU Datathon 2021 challenge #2. We believe that introducing Open Policy Analysis standards with open data, open-source software and research automation can help the economy that works for people, particularly the challenge we are focusing on the Single market strategy. Our collaboration is open for individuals, citizens scientists, research institutes, NGOS, companies.
Download our competition presentation
Our Product/Market Fit was validated in the world’s 2nd ranked university-backed incubator program, the Yes!Delft AI Validation Lab.
Services
Automated Data Services
 [Curation](/services/data-curation/)Data sits everywhere and it is not easy to find even at home. Our curators know where to dig.](/media/img/gems/Udachnaya_pipe.jpg) Curation Data sits everywhere and it is not easy to find even at home. Our curators know where to dig. | Uncut diamonds need to be polished. Data is only potential information, raw and unprocessed.](/media/img/gems/Uncut-diamond_Edit.jpg) Uncut diamonds need to be polished. Data is only potential information, raw and unprocessed. | Adding FAIR metadata exponentially increases the value of data. We use DataCite and SDMX statistical coding.](/media/img/gems/Diamond_Polisher.jpg) Adding FAIR metadata exponentially increases the value of data. We use DataCite and SDMX statistical coding. | Reusable, easy-to-import, interoperable, always fresh data in tidy formats with a modern API.](/media/img/gems/edgar-soto-gb0BZGae1Nk-unsplash.jpg) Reusable, easy-to-import, interoperable, always fresh data in tidy formats with a modern API. |
Recent Posts
Check out our more general Data & Lyrics blog.
Ongoing projects
See what we are doing, why we are doing it, and how you can contribute.
Data
API to our data, our sources, how we process and validate it, how we increase its quality.
Use Cases
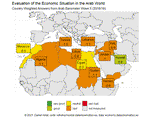
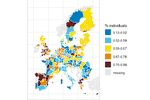
Data, Maps Produced & Their Uses
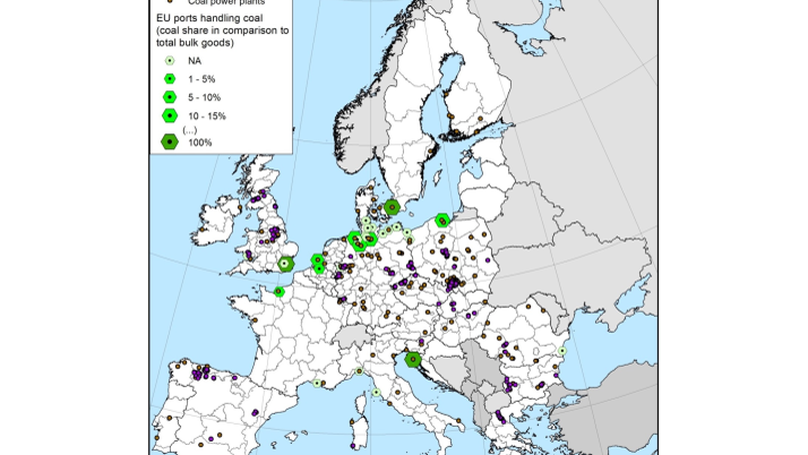
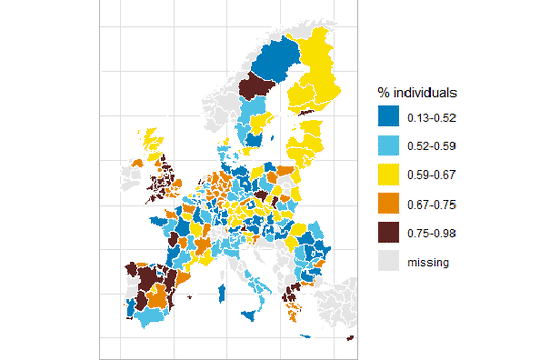
Our first use case is about identifying potential political roadblocks for climate policies. We are combining survey data about attitudes to climate change policies with socio-economic coal mining and and voting data. We examine the relationship between voter attitudes and economic dependency on coal mining.
Open-Source Software
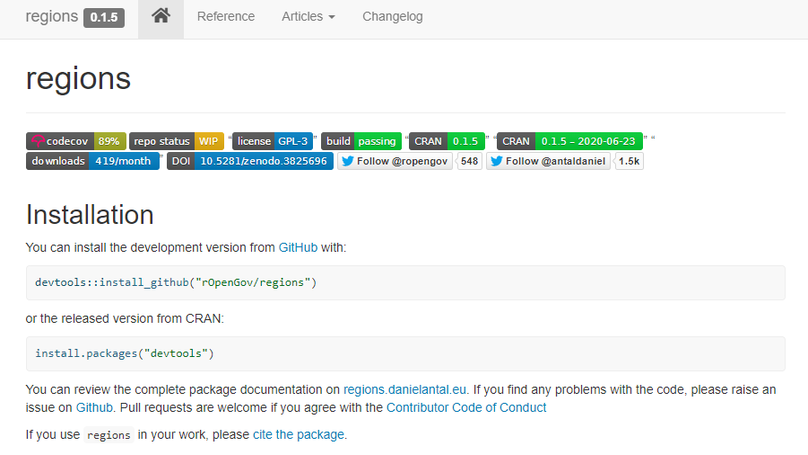
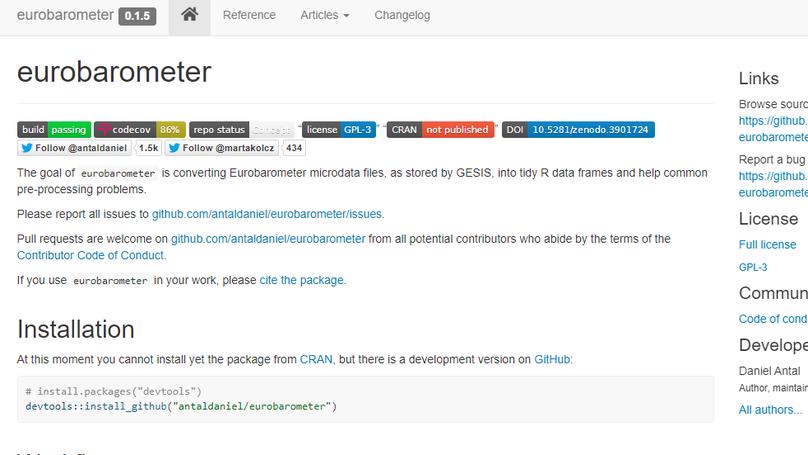
Our peer-reviewed, open source statistical software packages
We believe that transparency is the key to the highest data quality. We use only open source software. We open up the critical elements of our software for peer-review.
We use open-source software, there is no vendor lock-in.
Our data products go through many, automated (unit) tests, replacing countless error-prone human validation working hours.
The critical elements of our code go through external validation and peer-review by computational statisticians and data scientists.
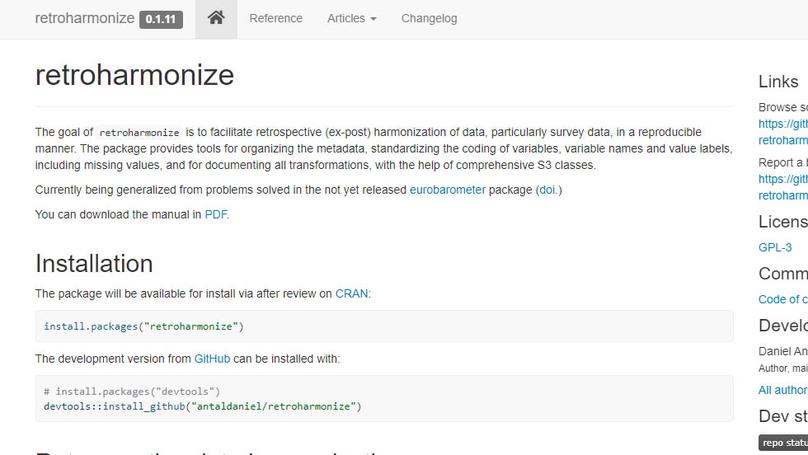
The goal of retroharmonize is to facilitate retrospective (ex-post) harmonization of data, particularly survey data, in a reproducible manner.
Open-Source Software
Our peer-reviewed, open source statistical software packages
Recent & Upcoming Talks
Conversations with users, contributors and volunteers.
Contact
- the Hague, NL-ZH
- Book an appointment
- DM Me
- Chat on Keybase


